Questa SIM User's Manual/Analyzing Assertions and Cover Directives
Содержание |
Analyzing Assertions and Cover Directives
The following tasks can be used for analyzing assertions and cover directives:
- Viewing Assertions in the Assertions Window
- Viewing Cover Directives in the Cover Directives Window
- Viewing Memory Profile Data
- Viewing Assertions and Cover Directives in the Wave Window
- Comparing Assertions
Viewing Assertions in the Assertions Window
Окна Утверждения (Assertions windows) отображают данные моделирования об утверждениях. Чтобы открыть окно Утверждения, выберите View → Coverage → Assertions из меню.
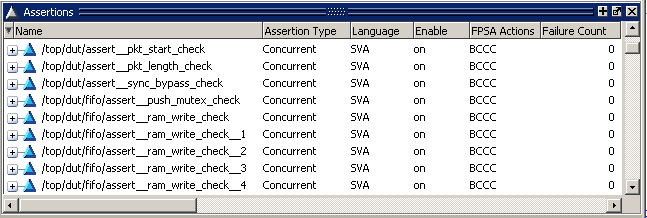
Рисунок 21-17 показывает SystemVerilog утверждения в окне Утверждения. Утверждения SV обозначены голубым треугольником. PSL утверждений (не показаны) обозначаются фиолетовым треугольником.

|
|---|
| Figure 21-17. SystemVerilog Assertions in the Assertions Window |
В окне Утверждения перечислены все встроенные и внешние директивы утверждений, которые были успешно скомпилированы и моделируемые в ходе текущей сессии. Знак плюс ('+') слева от поля "Name" позволяет расширить (раскрыть) иерархию утверждения, чтобы показать её элементы (свойства, последовательности, синхронизацию и HDL сигналы).
Окно Утверждения включает в себя несколько столбцов для отображения информации о утверждениях. Смотри GUI Elements of the Assertions Window для описания каждого поля.
Когда утверждения выдают сообщений об ошибке, окно Утверждения отображает имя и количество ошибок красным цветом, как во время моделирования так и в режиме пост-моделирования (рисунок 21-18).

|
|---|
| Figure 21-18. Assertion Failures Appear in Red |
Вы можете использовать команду assertion count, чтобы вернуть сумму числа ошибочных утверждений для заданного набора экземляров директив утверждений. Эта команда возвращает предупреждение (warning) "No matches", если заданный путь не содержит никаких утверждений.
Assertions Window Display Options
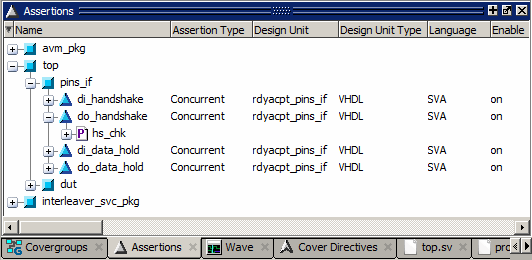
Окно Утверждения могут отображать директивы утверждений в иерархическом (дерево) виде (рисунок 21-19) или в плоском (flattened) виде (рисунок 21-17).

|
|---|
| Figure 21-19. Hierarchy Display Mode |
Режим иерархического отображения может быть включен или отключен с помощью одного из следующий действий:
- Когда окно Утверждения пристыкован (docked), выберите Assertions → Display Options → Hierarchy Mode в главном меню.
- Щелкните правой кнопкой мыши в окне Утверждения и выберите Display Options → Hierarchy Mode в всплывающем меню.
Меню Display Options также включает в себя следующие опции:
- Опция Recursive Mode отображает все утверждения на выбранном элементе иерархии и ниже, выделение (выбор элемента) берётся из окна Structure (например, закладка sim). В противном случае только показываются только те элементы, которые расположены на выбранному уровне.
- Опция Show All Contexts отображает все экземпляры в дизайне. В этом случае не учитывается, что выбрано в текущем контексте в панели Structure. Режим отображения Show All Context означает рекурсивный режим отображения как есть, так что выбор Recursive Mode автоматически серым цветом.

- Параметр Show Concurrent Asserts отображает только параллельные утверждения (concurrent assertions).
- Параметр Show Immediate Asserts отображает только непосредственные утверждения (immediate assertions).
Viewing Cover Directives in the Cover Directives Window
Окно "Cover Directives" отображает информацию о директивах покрытия. Чтобы открыть окно "Cover Directives", выберите View > Coverage > Cover Directives.
Рисунок 21-20 показывает PSL директивы покрытия в окне "Cover Directives". PSL директивы покрытия обозначаются фиолетовым шевроном. SystemVerilog директивыпокрытия (не показаны на рисунке), обозначаются светло-голубым шевроном.

|
|---|
| Figure 21-20. PSL Cover Directives in the Cover Directives Window |
The Cover Directives window displays accumulated cover directive statistics at the current simulation time, including percentages and a graph for each directive and instance. The plus sign (’+’) to the left of the Name field lets you expand the directive hierarchy to show its elements (properties, sequences, clocks, and HDL signals). Refer to GUI Elements of the Cover Directives Window for a description of each column.
Откроется окно Директивы Обложка накопленной статистики директиву крышка на текущий момент моделирования, в том числе проценты и графа для каждой директивы и экземпляра. Знак плюс ('+') слева от поля Название позволяет расширить директиву иерархию, чтобы показать его элементы (свойства, последовательности, часы и HDL сигналы). Обратитесь к GUI Элементы директив стекла крышка для описания каждого столбца.
Display Options for Cover Directives
Display options allow you to display cover directives in a Recursive Mode or in a Show All Contexts mode. For details, see Changing the Cover Directives Window Display Options.
Filtering Data in the Assertions and Cover Directives Window
You can filter the Assertions and Cover Directives data displayed by selecting Assertions > Filter > Setup or Cover Directives > Filter > Setup, depending on which window is active. For details, see “Filtering Functional Coverage Data”.
Viewing Memory Profile Data
The assertion profile command generates a fine grained profile of memory usage for assertions and cover directives. The results are displayed in the Memory, Peak Memory, Peak Memory Time, and Cumulative Threads columns of the Assertions and Cover Directives windows.
- The Memory column tracks the current memory used by the assertion or cover directive.
- The Peak Memory column tracks the peak memory used by the assertion or cover directive.
- The Peak Memory Time column indicates the simulation run time at which the peak memory usage occurred.
- The Cumulative Threads column counts the cumulative thread count for the assertion.
While the Cumulative Threads count is not specifically about memory, it is designed to highlight those assertions and cover directives that are starting too many attempts, such as the following assertion:
assert property ((@posedge clk) a |=> b);
If ‘a’ is true throughout the simulation, then the above assertion will start a brand new attempt at every clock. An attempt, once started, will only be alive until the next clock. So this assertion will not appear abnormally high in the Memory and Peak Memory columns, but it will have a high count in the Cumulative Threads column.
Viewing Assertions and Cover Directives in the Wave Window
You can view assertions and cover directives in the Wave window just like any other signal in your design. Use one of the following methods to add directives to the Wave window:
- To add all assertions in your design to the Wave window,
- Select a single object in the Assertions window, then select Add > To Wave > Objects in Design from the main menus.
- Select all objects in the Assertions window, then select Add > To Wave > Selected Objects from the main menus
- Right-click the selected assertions, then select Add Wave > Objects in Design from the popup menu.
- Select all objects in the window, then click the Add Selected To Window button in the Standard Toolbar.

- To add all cover directives in your design to the Wave window:
- Select a single directive in the Cover Directives window, then select Add > To Wave > Functional Coverage in Design from the main menus.
- Select all directives in the Cover Directives window, then select Add > To Wave > Selected Functional Coverage from the main menus.
- Right-click the selected cover directives, then select Add Wave > Functional Coverage in Design in Design from the popup menu.
- Select all directives in the window, then click the Add Selected To Window button in the Standard Toolbar.

- To place a single assertion or cover directive in the Wave window:
- Drag the object from the its window and drop it into the Wave window, or simply drop it onto the Wave tab if it is showing.
- Select the object, then click the Add Selected To Window button in the Standard Toolbar.
- Select the object then select Add > To Wave > Selected Objects from the menu bar.
- Right-click any selected assertion and select Add Wave > Selected Objects from the popup menu; or right-click any selected cover directive and select Add Wave > Selected Functional Coverage from the popup menu.
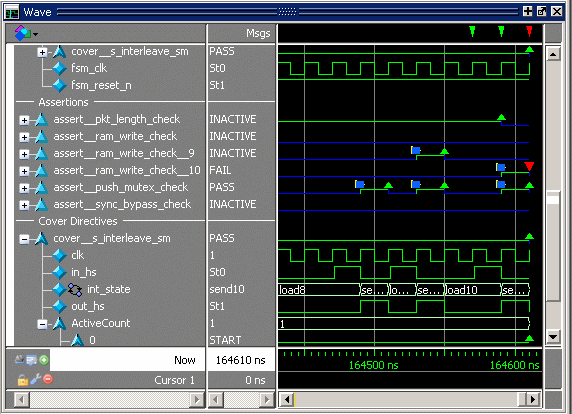
Questa SIM represents assertions and cover directives as signals or waveforms in the Wave window. The Wave window in Figure 21-21 shows several SystemVerilog assertions and a single cover directive. SystemVerilog assertions are represented by light blue triangles in the pathnames column. SystemVerilog cover directives are represented by light blue chevrons.

|
|---|
| Figure 21-21. SystemVerilog Assert and Cover Directives in the Wave Window |
The Wave window in Figure 21-22 shows several PSL assertions and cover directives. PSL assertions are represented by magenta triangles. PSL cover directives are represented by magenta chevrons.

|
|---|
| Figure 21-22. PSL Assert and Cover Directives in the Wave Window |
The name of each assertion and cover directive comes from the assertion code. The plus sign (’+’) to the left of the name indicates that an assertion or cover directive is a composite trace and can be expanded to show its elements (properties, sequences, clocks, and HDL signals). Note that signals are flattened out; hierarchy is not preserved.
The value in the value pane is determined by the active cursor in the waveform pane. The value will be one of ACTIVE, INACTIVE, PASS, FAIL, or ANTCDENT.
The waveform for an assertion or cover directive represents both continuous and instantaneous information.
- Continuous information is either active or inactive. The directive is active anytime it matches the first element in the directive. When active, the trace is green; when inactive it is blue.
- Instantaneous information is represented as a start, pass, or fail event. A start event is shown as a blue square. A green triangle represents a pass. And a red triangle indicates a fail.
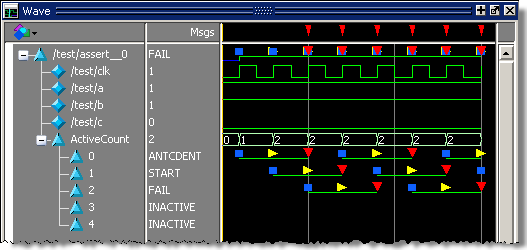
A yellow triangle represents an antecedent match (Figure 21-23). The yellow triangle is displayed only if the directive is browseable and assertion debug is on (vsim -assertdebug). The yellow triangle is shown for each thread of the assertion under ActiveCount in the assertion (see Using the Assertion Active Thread Monitor). The signal values of the assertion also reflect the antecedent match (ANTCDENT).

|
|---|
| Figure 21-23. Antecedent Matches Indicated by Yellow Triangle |
Table 21-1 summarizes the graphic elements for assertions and cover directives used in the Wave and ATV windows (see Viewing Assertion Threads in the ATV Window):
| Graphic element | Meaning |
|---|---|
| blue line | assertion or cover directive is inactive |
| green line | assertion or cover directive is active |
| blue square | assertion or cover directive starts |
| green triangle | assertion or cover directive passed |
| red triangle | assertion or cover directive failed |
| yellow triangle | antecedent match occurred in assertion |
Displaying Cover Directives in Count Mode
You can change the coverage directive waveform in the Wave window so it displays in count mode format, which shows the instantaneous waveform value as a decimal integer. To change to count-mode format, right-click a coverage waveform name and select Cover Directive View > Count Mode.

|
|---|
| Figure 21-24. Viewing Cover Directive Waveforms in Count Mode |
Count mode can be useful for gauging the effectiveness of stimulus over time. If all cover directive counts are static for a long period of time, it may be that the stimulus is acting in a wasteful manner and can be improved.
Comparing Assertions
Questa SIM’s compare feature allows you to compare assertions (which includes any assertion-like object such as accAssertion, accCover, accEndpoint, or accImmediateAssert.) There is no cross-compare with assertion types outside the set listed, and assertion compare is further limited to like types only. That is, both the reference and test items must be of the same type.
Comparing assertion signals differs from comparing normal HDL signals/ports because assertion signals have two attributes:
- The current assertion state (ACTIVE | INACTIVE)
- The current assertion event (START | PASS | FAIL | EVAL)
Assertions expand to show child signals but these child signals don't participate in the compare evaluation. Child signals are, however, visible in the compare waveforms when the you expand compare assertions.
Setting Up the Assertions Compare
You can set up and run an assertion compare using the compare commands or the menu-based Waveform Comparison Wizard. For example, a comparison using compare commands may look like the following:
add wave /top/assert_sig
run 1000 ns
dataset open vwim_test.wlf
compare start sim vsim_test
compare add sim:/top/assert_sig vsim_test:/top/assert_sig
compare run
All existing compare commands are supported for comparing assertion signals. Refer to the Command Reference for syntax and command descriptions.
The Waveform Comparison Wizard will guide you through the selection of a reference dataset and a test dataset. Assertions within those datasets are compared along with other signals. You can start the Wizard is by selecting Tools > Waveform Compare > Comparison Wizard.
The Compare Signal
When two assertion signals are compared — for example, vsim_pass:/top/my_assertion_sig and vsim_fail:/top/my_assertion_sig — a third virtual signal is created:
compare:/top/\my_assertion_sig<>my_assertion_sig\
The compare signal created is composed of the reference signal and the test signal. Differences between the reference and text assertion signals are highlighted in red in the compare signal when it is displayed in the Wave Window. Assertion differences cannot be viewed in the ATV window.
Two Types of Assertion Differences
There are two types of assertion differences:
- Instantaneous difference — When the assertion event (START | PASS | FAIL | EVAL) is different but the state of the assertion (ACTIVE | INACTIVE) is the same.
- For example, considering two datasets vsim_top and vsim_ntop with an assertion signal my_assertion_sig.
vsim_top:/top/my_assertion_sigis PASS_INACTIVE at 20 nsvsim_ntop:/top/my_assertion_sigis FAIL_INACTIVE at 20ns
- This is an instantaneous difference the difference will marked at time 20 ns and the width of the difference marker will be equal to the width of the PASS/FAIL symbol.
- Range difference — When there is a state change (ACTIVE->INACTIVE) or vice-versa, between the reference and test assertion, irrespective of the event on the assertions.
Child Signals
An assertion object is composed of child signals. It is the evaluation of these child signals that determine the assertion event (START/PASS/FAIL). If you choose to expand the assertion, the difference marker is propagated to the child signals as well, but this may not necessarily mean a change in value on the child signal at that specific time — the difference could have occurred earlier.
If the reference signal has child signals but the test signal does not, or vice-versa, waveform compare will still work because compare cares only about the absolute event on the assertion. If there is a difference, it will be marked.